Providing the appropriate color spectrum is just one dimension of successful marijuana growing. In fact color spectrum has less to do with yield than most lighting manufacturers care to admit.
There is a second consideration that is even more important than the spectral mix of colors a lamp produces. Maximizing cannabis harvest yields requires the correct level of light intensity be supplied as well. But total intensity measurements such as PAR can be misleading. We'll discuss why and also a solution. Measuring the individual wavelengths of light which when added all together equals total PAR.
With photo spectrometers becoming less expensive and more portable it's now possible to measure any grow lamp right at the grow. One such tool is Asensetek's Lighting Passport and their free mobile App Spectrum Genius Agricultural Lighting or SGAL. We like the Passport because it not only gives us total PAR, but it also breaks down the individual spectrum into 1 nanometer wavelengths and we can see the amount of PPF being created at any distance from the lamp for that single wavelength. Imagine being able to compare lamp to lamp, HPS to LED. Florescent to LED. Or better yet, the Sun to any lamp made today. We can now reverse engineer spectrum and light intensity to any lamp or directly to the sun.

Asensetek Lighting Passport - shown with optional IPOD or IPAD and free SGAL App
If we can agree that our sun is the benchmark for the right mix of spectrum for photosynthesis, then we need to also look at exactly how much light measured in total intensity the sun provides as it passes through the sky.
The best starting point is to look at the sun’s light intensity at noon on a summer day in an area like California where cannabis flourishes outdoors. Not only do we look at the mix of color spectrum the sun produces, we also need to understand the exact amount of light intensity the sun rains down on plants in each wavelength of color. PPF (photosynthetic photon flux) is the measurement of the amount of micromoles that land on a target area - for example the top canopy of cannabis plants. And PPFD simply adds a distance measurement to PPF.
At noon on a sunny day in California in June we measured the PPFD from the sun at 1978 micromoles (Figure A). Closer to the equator that number is higher and further north it drops lower. And of course at night it is zero.
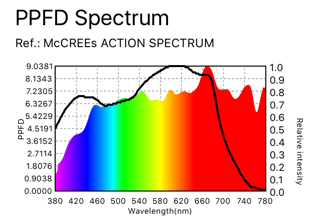
Figure A; Sun light spectrum and intensity per wavelength in micromoles in California in June at noon
The chart above shows PPFD (photosynthetic photon flux density in micromoles - the amount of photosynthetic light that actually hits your target area) scaled on the left. Wavelengths are scaled at the bottom. We can see for example that in the 600NM orange/red wavelength that the sun is peaking at about 7 micromoles. Regardless of the type of lighting, HPS versus CMH versus Fluorescent versus LED, it’s important to use the sun as the ultimate baseline of comparison.
The black line represents the McCree Action Curve, photosynthetic light level where all plant life benefits optimally. Light within the curve is ideal. Beyond the curve is unused by plants. The McCree Curve is an important target when choosing an artificial lamp for growing marijuana.
Cannabis plants can’t tolerate 2000 micromoles of energy for a 12 hour growing day. So we look at the average amount of sunlight which plants receive during the entire day.
Average outdoor PPFD for a 12 hour day ranges widely however a June average in California is about 1000 micromoles.
We know from hundreds of cannabis grow tests with a wide variety of artificial lighting types that yields will improve when the canopy is continually provided with between 800-1200 micromoles. Our testing has shown that 1000 micromoles is an ideal target for average top canopy lighting. Some flowers will stretch into higher light levels while others will be below the average canopy and receive less. Providing 1000 micromoles also ensures flowers deeper in the plant canopy benefit from the intensity as well which results in increased dry weights and premium “A type” flower yields.
Looking back at Figure A we can use a rule of thumb that the average daily intensity we target on canopy for any specific color wavelength will be about half of what the chart shows for actual California maximum light intensity. So for example in that same 600NM orange/red peak we discussed above of 7 micromoles, we know that we need to find an artificial light source that provides at least 3.5 micromoles for the entire flower cycle for that wavelength. Any light source which does not achieve the target average will result in sacrificing plant yields.
We also know that traditional HID (high intensity discharge) lamps are considered the gold standard in indoor gardening. Gavita double ended high pressure sodium lamps have been one of the most popular lamps for years for flowering. And Gavita ceramic metal halide lamps, which include more blue, are popular for the vegetative phase of growing. Likewise T5HO fluorescent lamps are popular for the clone phase and early veg phases.
As much as we want to try to replicate the balanced spectrum and average intensity of sunlight, FGI decided that we better also focus on understand why traditional lighting works and be sure to include this spectrum and intensity in our lamps as well.
We’ve visited hundreds of indoor grows using Gavita style lamps. Most growers tend to have the lamps hung between three and five feet above the top of the maturing canopy. Less than three feet begins to risk burning the plants from the heat the lamps produce. And further away than five feet the plants begin to look spindly and less healthy. Measurements of Gavita HPS spectrum and intensity look like Figure B below.
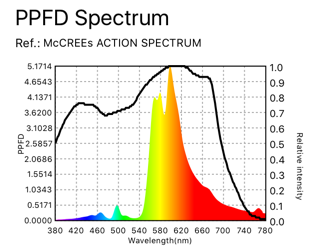
Figure B; Gavita 1000 w pro HPS spectrum and intensity at 36” from canopy
As compared to the sun peaking at 7 micromoles of orange/red energy – and our rule of thumb goal of providing 3.5 micromoles of average over 12 hours-- we can see that the Gavita does pretty well and is peaking above the target average at 5 micromoles. Gavita lamps work well in cannabis growing so it reasons to follow that any other lamp being considered to grow cannabis needs to be in this range. Anything below this range won’t grow the highest yielding plants.
As a comparison, the Gavita ceramic metal halide lamps which work well during the veg cycle clearly don’t provide the orange/red energy that their HPS lamps produce. Figure C below shows the Gavita CMH spectrum and intensity also at 48 inches above canopy. Total orange/red 600nm peak light production is 2 micromoles which explains why high yields cannot be obtained because the lamp produces 30% less light than the target of 3.5 micromoles of natural sunlight.
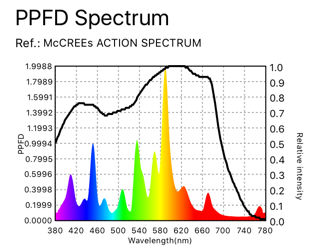
Figure C; 660 watt Gavita ceramic metal halide lamp at 48” above canopy
We do know that the Gavita CMH lamps have proven to work well during the veg phase of cannabis growing and most growers keep their CMH lamps high above the canopy. Using the data we gathered in Figure C we know that veg plants desire blue light in the 440nm wavelength range. The CMH chart shows peak blue energy at about 1 micromole on average for a 20 hour veg operation. Looking back to the sun in Figure A we can see that a little over 5 micromoles of peak energy is produced and using the rule of half, our target is 2.5 micromoles. It could be said that the Gavita, at 48”, is not hitting the blue light target. And this is where hanging height on lamps becomes a tradeoff of benefits versus harm. In this example the CMH lamp should be closer to the plants.
If we lower the Gavita CMH lamp to increase the level of 440NM blue, then we’ll also increase the level of 600nm orange/red which we know from experience produces early stretching of the plants. Depending on style, many growers prefer more compact and lush veg plants prior to moving them in to flower and pruning to encourage formation of flower nodes and branching which maximizes production as the plants mature. Too much red will trigger the wrong type of growth.
Fluorescent lamps which are popular during cloning and earlier veg phases of growing is worth taking a look at too. Figure D below is a typical T5HO 8 tube lamp at 20” over young veg plants.
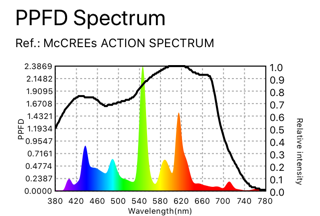
Figure D; T5HO 8L fluorescent lamp at 20” over canopy
Figure D helps to explain why Gavita CMH lamps and fluorescent lamps both work well for veg phase growing. They both produce peak energy in blue and orange/red. Peak 440nm blue is almost 1 micromole and peak 600nm orange/red is about 1.5 micromole. For very young plants our rule of thumb for light intensity should be 25% of the suns peak energy. Fluorescent lamps achieve that average however due to the spikey looking spectrum the plants are not receiving the broad range of spectrum the sun produces. This is another good reason not to look at total PAR because a fluorescent lamp might seem to be producing good total amounts of photosynthetic light but we can see that it’s not a consistent amount of light across the spectrum.
So now we have a pretty good target to aim for. We understand targeted light intensity from studying the sun. And we know that Gavita lamps work well in flower and veg. And that fluorescent lamps work well in clone and veg.
Any lamp you consider moving forward should provide targeted average intensity from the sun and all the benefits of the Gavita and T5s. Any lamp which lacks our target spectrum or intensity is likely not to work very well in the various stages of cannabis growing.
Evolution of LED grow lighting
LED grow lighting is an evolving area of study. Many growers are suspicious about the benefits of LED, having tried products that didn’t work in the past or heard from the community they don’t work. And for good reason. We’ve taken hundreds of measurements from dozens of LED lamps across the entire industry. We’ve had growers show us plants that don’t stack up well as compared to plants under Gavita or T5s.
Figure E below is good example of why not all LED lamps work as well as the sun or Gavita. The Illumitex Powerharvest LED spectrum and intensity is different than what we’ve decided our target is. And we can also see why the grow results are very different than Gavita.
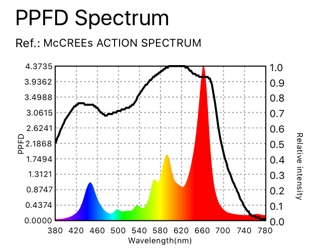
Figure E, Illumitex Powerharvest LED as 36” above canopy
As compared to flowering under Gavita HPS the Powerharvest will only supply peak 600NM orange/red energy of less than 1 micromole versus our sun target of 3.5 or Gavita actual production of 5 micromoles. There is a major difference in 660NM red energy. Looking back at Figure A and what the sun produces with a peak of 8 micromoles of 660NM red, the Powerharvest is producing over 4 micromoles. That is within our “rule of thumb” target of 50% of the sun’s noontime output. But it’s 400% higher than what the Gavita produces of the same red energy. Experience has shown that very high levels of red energy cause the plants to stretch faster which can cause the plants inter-nodal flower spacing to be too far apart and become spindly. Light bleaching of the top flowers can also become a problem.
But some growers do just fine with the Powerharvest, too, which tells us that cannabis can be grown under a variety of light conditions as long as the appropriate intensity is provided too. However at FGI we prefer to target the spectrum and intensity of the sun and Gavita because so many growers swear by the results.
We now have a good understanding of how to target any lamp you are considering not just in terms of light spectrum but more importantly in terms of the amount of energy we are supplying to the canopy in micromoles at any wavelength we feel is most important.
Targeting light intensity on canopy
The grow lamp industry, both traditional and LED does a poor job of supplying complete information about lamp intensity.
Most manufacturers supply only total PAR, which is the sum total of all the energy between 400-700NM. Total PAR does not include the individual spectral components of the light, thus is not a useful number and should be avoided in decision making.
The total PAR output of the sun peaks at 2000 micromoles at noon. The total PAR output of the Gavita Pro HPS hung at 36” is 470 micromoles. Total PAR output for the Illumitex Powerharvest, above, was 620 micromoles. However the makeup of those total amounts of PAR was very different and the plants development and harvest yields achieved under these light sources were also different.
At FGI we have a vast library of spectrum and light intensity data. As we designed our own line of lamps made here in Washington we used this data to target both the color spectrum we knew worked by grouping the highest yielding grow lamps together and separating out the average or below average lamps.
At a minimum, we wanted to incorporate the light spectrum and intensity of Gavita HPS for flower and CMH for veg. But we also chose to incorporate additional broad light spectrum which we knew from measuring the sun and outdoor grows is the proper target.
And most important, we designed our lamps to achieve very specific light intensity (PPFD) levels in each wavelength that makes up the total PAR output of our lamps.
Designing a lamp to hit targeted intensity while also reducing energy use is a tricky balance.
If the light is fixed at a certain height and light levels are too high or too low we have just two options. Either the voltage must be increased or decreased to hit the target intensity through dimming.
The second option is to physically move the light source closer or further from the plant canopy. When designing spectrum and intensity for cannabis with an eye to energy conservation, LEDs have a clear advantage. And to take full advantage of all that valuable photosynthetic light the lamp is producing it makes most sense to hang the lamp closer to the canopy to avoid the loss of light which occurs as the distance from the plants increases. This is where additional strategies like automated light lifting becomes important because we can slowly raise the lamps as the plants stretch.
The new generation of diodes are much more energy-efficient than older higher-wattage LEDs. The chips operate at much lower heat output. In doing so light output from a single diode is also less in terms of PAR output. But arranging the diodes closer together allows us to create the intensity we prefer.
Hanging the lamps closer to the canopy allows us to manufacture lamps which consume fewer watts and save more energy. This translates to lower cost of production in cannabis growing and higher efficiency of grams per watt produced. Secondary benefits of lower hanging heights include the ability to grow vertically in racks because LEDs run cooler. High Intensity Discharge, lamps like HPS and CMH, cannot be hung as close to the canopy without burning the plants or creating too much heat under the plant levels above, so vertical growing is nearly impossible with older style lamps.
The FGI line of LED lamps
FGI designed a full line of lamps for each stage of growth. Our 100 watt Lightbar is a low intensity lamp designed for cloning or earlier veg stage growth. Likewise our 185 watt Lightbar is designed for medium intensity to replace T5HO fluorescents and CMH used in veg. And our two 500 watt and 700 watt Lightpanels are designed to replace HPS lamps in flower.
How FGI stacks up against the competition
Flower/bloom
The FGI Lightpanel 700 and 500 use the same spectrum but have different light intensity output for different types of installations. The 500 watt Lightpanel produces the highest amount of light intensity over a smaller amount of area. The 700 watt Lightpanel covers a greater area of canopy.
Figure F shows the spectrum and intensity at 18” hanging height, the most efficient height for maximum intensity.
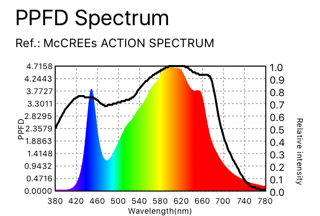
Figure F; FGI Lightpanel 500 V/B at 18”
Using the rule of thumb developed from looking at the sun in Figure A and the Gavita HPS in figure B, we targeted orange/red energy peaks at a high of 5 micromoles (Gavita) and a low of 3.5 (average sun). The Lightpanel achieves the goal: coming in just under 5 micromoles. Looking at the blue energy produced by the sun we targeted 2.2 micromoles and the Lightpanel exceeds that measurement at 3.7.
The Lightpanel has all the benefits of the spectrum and intensity preferred by Gavita HPS users but it also includes much more of the full spectrum of light the sun produces, setting it apart from a typical HPS lamp and moving the spectrum closer to that of outdoor California sun. Total PAR output for the Lightpanel (above) at 18” is 1136 micromoles, just under the 1200 micromole maximum light intensity recommended for cannabis.
Veg/clone
The FGI Lightbar 100 and 185 use the same spectrum as one another but in different intensities based on the desired light levels for young plants versus maturing veg plants.
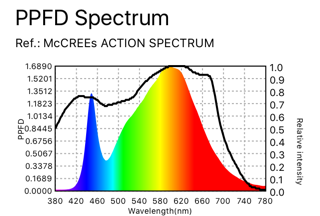
Figure G; FGI Lightbar 185 at 18”
As compared to preferred CMH lamps (figure C) made by Gavita, the Lightbars produce peak blue energy of 1.3 micromoles, (equal to the CMH output) and peak orange/red energy of 1.7 micromoles (also equal to the CMH output.) Once again our spectrum and intensity includes all the preferred light of Gavita CMH but also adds in much more of the full spectrum the sun produces which is lacking in CMH lamps.
The same is true in comparison to T5HO lamps (figure D). The Lightbars exceed the amount of preferred blue and orange/red light produced by fluorescents and also include most of the green energy which is not found in CMH lamps.
Summary
It becomes clear that light spectrum is only a part of the equation when comparing various lamps. And looking only at total PAR output misses the mark too. But when spectrum and PAR output are combined into direct comparison between what has worked well for growers over time. Then adding in a comparison of the sun, nature’s best grow light, the science behind lamp design can be demystified. We can now design a very specific light spectrum and very specific light intensity allowing us to push the yield and potency to the maximum potential output.
Large scale commercial cannabis growing requires maximizing harvest yields time and time again, while focusing on the reduced cost of electrical operation for lamps and heat removal. Paired with generous incentives offered by many utilities to convert from high energy HPS, CMH, and fluorescent lamps, the return on investment for installing the new generation of cannabis-tuned LED now makes sense more than ever before.


